

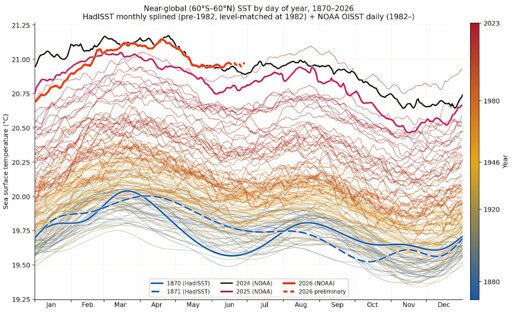
The world’s oceans are the hottest on record for June, pushing past records set during the 2023–24 El Niño years.
From Earth News - Earth Science News, Earth Science, Climate Change via This RSS Feed.
The world’s oceans are the hottest on record for June, pushing past records set during the 2023–24 El Niño years.
From Earth News - Earth Science News, Earth Science, Climate Change via This RSS Feed.
Yeah, I was just trying to figure out how the data works. Like is the first cluster made up of the oldest data points and then basically a bunch of years get clustered there, then they jump a bit and they cluster there and so on 5 times. Or do we see some years at random clustering around 5 main regions with the latest years at the very top.
When I clicked in the link there’s a waterfall chart showing that it sort of has eschalons so it’s clustering at 5 increasing steps. Not 100% sure, but I think that’s what it is. So I wonder if each of the 5 jumps are connected to new tech or energy policy changes.