

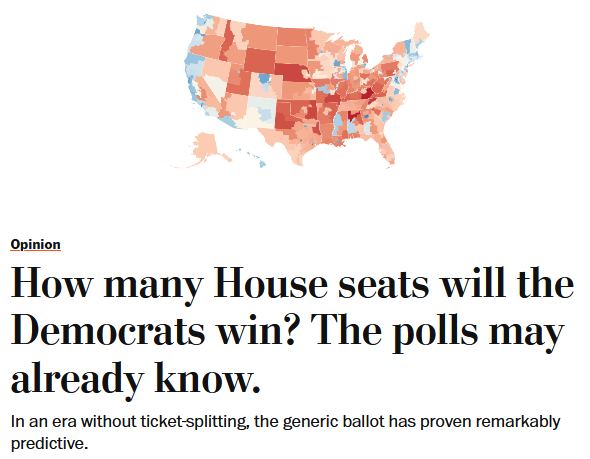
The Washington Post‘s Henry Olsen (9/30/26) points out that average polling for the House election has been remarkably predictive—in the last two midterms.
The conventional media consensus these days suggests the midterm election this November will result in a “blue wave,” with Democrats winning a majority in the House and picking up seats in the Senate—possibly enough for majority control.
In this spirit, Washington Post columnist Henry Olsen (9/30/26) writes that the generic ballot—polling that asks which party a respondent is likely to vote for in the upcoming congressional election—is “remarkably predictive” of midterm elections. He suggests, based on that measure, that Democrats this coming November should win between 225 and 232 House seats—up from their current 214, with 218 needed for a majority.
His conclusion about the predictiveness of the generic ballot is based on his analysis of the past three midterms—2022, 2018 and 2014. He correctly notes that in 2022, the Republicans led the final RealClearPolitics generic ballot average by 2.5 percentage points, quite close to the actual GOP edge in seats: Republicans won 222 and Democrats won 213, which works out to a margin of 2.1 points. In 2018, Democrats led the final RCP average by 7.3 points, and won a majority of House seats with a margin of 8.3 points.
He somehow mistakes the numbers in 2014, noting accurately that Republicans led the final RCP average by 2.4 percentage points, but erroneously stating that they won the election for House seats by 5.7 points. The GOP won the national vote—the total votes cast in all House races—by that amount, but won the House vote by 247–188, a margin of 13.6 percentage points, 49 more seats than predicted by the RCP average.
The cautionary point here is that the generic ballot predictions over the past quarter of a century have sometimes wildly over-predicted, and sometimes wildly under-predicted, the winner. Olsen’s analysis of the past two midterms does in fact show the final RCP average close to the actual election results. Thus, assuming that this year’s results will mirror the past two midterm votes, the current (as of this writing) RCP average of 8.3 points in favor of the Democrats suggests they would win about 36 seats more than the Republicans. But it is not at all certain that this midterm election will mirror the past two.
In Table 1, the history of the RCP average is shown for each biennium since 2002, compared with the actual election results. The table lists 1) the final RCP generic polling average (blue numbers indicate a Democratic lead, red numbers a Republican lead), 2) the percentage of House seats won by the winning party, and 3) which party did better than expected and by how much.
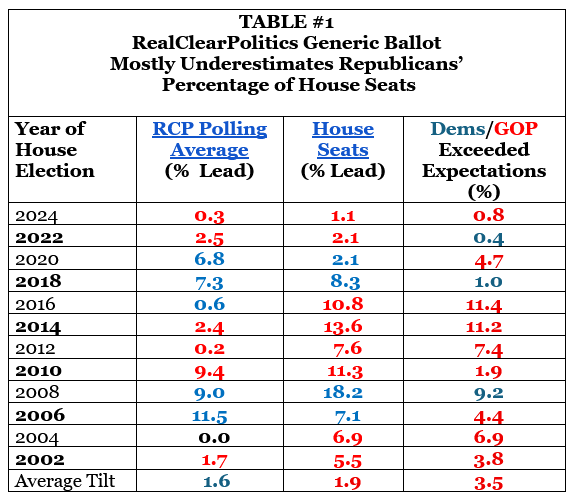
The third column shows how much larger the partisan margin of House seats was than was predicted by the generic ballot polling average.
Note that in all but one race (2016), the party with a lead in RCP‘s generic ballot average ended up with control of the House. (In another race, 2004, neither party led in the polling average.) And in three races—2024, 2022 and 2018—that polling average came within a percentage point of predicting the actual number of seats won by the majority party.
In 2020, however, Democrats led the final RCP average by 6.8 points, while their actual margin of victory was only 2.1 points—winning by a margin of only 9 seats, rather than the 30 seats predicted by the RCP average.
In fact, as the last column on the right shows, in 7 of the 12 elections (2002–06, 2012–16, 2020), Republicans did substantially better than expected, by 3.8 points to 11.4 points. Only in 2008 did Democrats substantially outperform expectations, by 9.2 points. In the other four elections, the generic ballot average was within 2 percentage points of the actual portion of House seats won.
Why were the RCP averages so far off from the actual outcomes in 8 of the 12 midterm elections? If we had a precise answer to that question, it would help us understand whether this year’s pattern will mirror the past two elections, or perhaps some other year. But a precise answer is elusive.
Generic ballot and national vote
It’s important to note that the substantial discrepancies between the final RCP average and the percentage of seats won is not due solely to inaccurate polls. The generic ballot measures the national vote preference, while House seats are determined by the election results in each of 435 congressional districts. In theory, one party could win every district by 50.1% of the vote, and therefore win 100% of the seats. Such is the possibility in single-member, winner-take-all congressional districts.
Fortunately, US congressional districts are not all the same, so the outcome suggested above is unrealistic. Because of large variations in districts, the generic ballot provides an overall insight into national sentiment, which is—imperfectly—reflected in the actual distribution of House seats.
As shown in Table 2, the RCP final average does a respectable job in predicting the national vote. Over the past 12 elections, Republicans have performed better than predicted in seven of the elections, Democrats in four. (I treat 2022 as a tie.) But the percentage discrepancies are fairly small—from a high of 3.7 points (underestimating Republican strength in 2020) to a high of 2.6 points (underestimating Democratic strength in 2010).
The average bias over the whole period underestimates Republicans by just over one point, while the average error in either direction is 2.3 points.
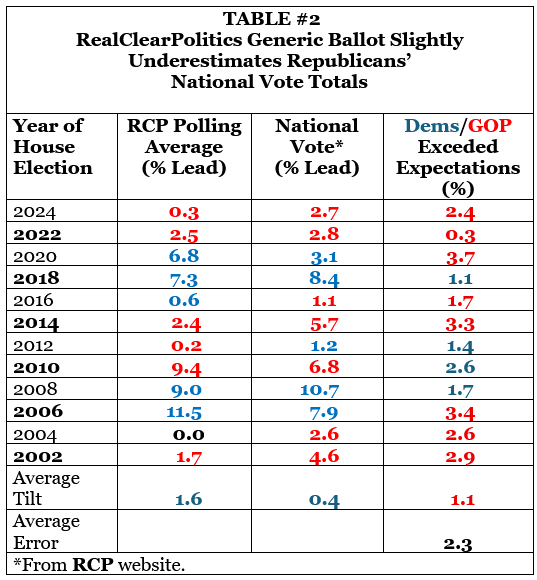
The third column shows how much larger the partisan margin for total House votes was than was predicted by the generic ballot polling average. Average tilt measures the partisan bias of the polling compared to the actual result. Average error measures the total error, whether towards one party or the other.
Given the not-too-bad accuracy of the generic ballot, why are there such large discrepancies between the RCP average and the number of House seats won by the majority party in 2004–08, 2012–16 and 2020? That’s where the constitutional structure of single member, winner-take-all districts comes into play. The national popular vote does not translate directly into the number of House seats a party will win.
National vote and House seats
Table 3 shows that in half of the past 12 elections (2002, 2006, 2018–24), the number of House seats won by each party has closely mirrored the national vote totals, agreeing within 2 percentage points. In the other six elections, the number of House seats won by each party diverged substantially from the national vote: In five of these elections, the proportion of seats won by Republicans exceeded their share of the national vote by a minimum of 4.3 percentage points in 2004 to a high of 9.7 points in 2016, giving them between 19 and 42 seats beyond their proportion of the vote. Only in 2008 did Democrats earn a winning margin substantially greater (7.5 percentage points more) than the national vote, giving them 33 extra seats.
In all elections but one, the party that won the popular congressional vote ended up with the most seats. That exception was in 2012, when the Democrats won the national vote by 1.2 percentage points, while Republicans won a House majority with a 7.6 point margin.
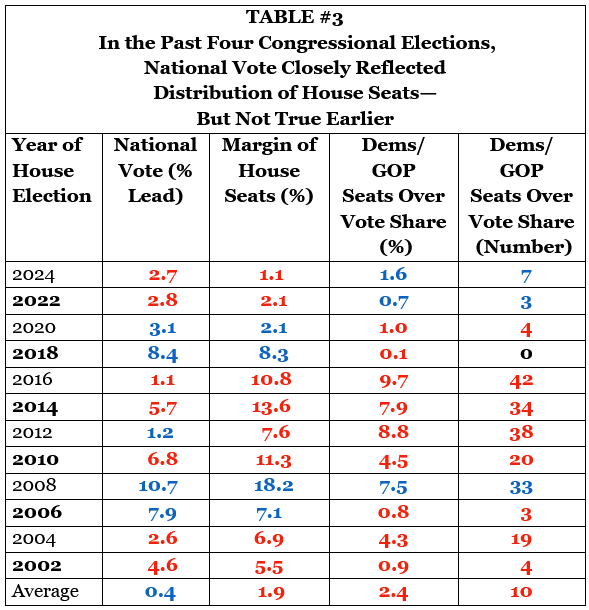
The third column shows how many percent more seats Democrats or Republicans won than they would have if the distribution of seats had exactly matched the total national vote. The fourth column shows the actual number of excess seats each party won over the national vote.
This table is the most useful for understanding the current political situation. It shows Democrats winning in 2006 (George W. Bush’s second midterm) and 2008 (when Barack Obama was first elected), and again in 2018 (Trump’s midterm) and 2020 (when Biden won the presidency).
Given the pattern of past elections (where the out-party tends to fare well in the midterms), it is not unreasonable to expect the Democrats to regain control of the House this November. The current RCP average of 8.3 points in favor of the Democrats is right in line with 2018, when they enjoyed an 8.4 point margin and won by 8.3 points, a 36-seat advantage.
Still, the elections in 2004 and 2010–16 all found the Republicans winning substantially more House seats than what the national vote predicted. One possible explanation could be that those elections were characterized by a much more robust gerrymandering effort by the Republicans than by the Democrats.
Countering that explanation is the 2008 election, when Democrats outperformed the national vote by 7.5 points. It seems highly unlikely that this result was related to the Democrats suddenly gerrymandering more congressional districts. It’s more likely that in 2008, Democrats experienced unusually high turnout after eight years of Republican control.
District-by-district analysis
While the generic ballot provides a national picture of voter preferences, at least two organizations analyze the past and current political leanings in each of the 435 districts: The Cook Political Report, and Sabato’s Crystal Ball at the University of Virginia’s Center for Politics. They classify each district according to their likelihood of voting for either party: Safe seat for the party, Likely, and Lean, with the rest classified as toss-ups.
According to the most recent Cook Report (10/16/26), Democrats enjoy a 14-seat lead (214–200) based on districts that at least “lean” in one party’s direction, with 21 districts a toss-up. Sabato’s Crystal Ball (10/20/26) has Democrats with a 23-seat lead (223–200) and 12 toss-up districts.
Because of the similarity, the table shows only the Cook Report results.
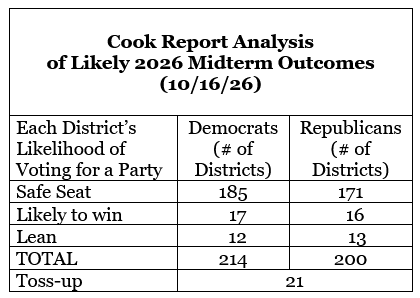
Democrats lead in the number of safe seats, holding 185 to Republicans’ 171 safe districts. An additional 28 districts favor Democrats (17 likely, 12 lean), while 29 districts favor Republicans (18 likely, 9 lean).
In an analysis of these numbers, Erin Covey of the Cook Report (10/9/26) expects “Democrats to pick up from nine to 19 seats, giving them 224 seats on the lower end [a 13-seat margin] and 234 on the upper end [a 33-seat margin].”
The lower-end projection suggests Democrats would win the 214 seats already in their column and pick up 11 of the toss-up districts. The higher-end projection envisions Democrats picking up all 21 toss-up districts.
The lower end is also suggested by partisan strategists Karl Rove and David Axelrod, Republican and Democrat respectively, when they agreed with each other on PBS (10/1/26) that Democrats will definitely win majority control of the House, but with only a “modest” advantage of about 15 or so seats (a 3.4 point margin).
Is a blowout possible?

Bill Scher (Washington Monthly, 9/25/26) notes the correlation between change in real disposable income and the prospects of the party in power in midterm elections; from July 2025 to June 2026, people’s spending power declined by 0.5%.
The possibility that Democrats could fare much better than the generic ballot results, let alone the more guarded prognostications by the political strategists, is suggested by the election in 2008, when Democrats enjoyed the largest RCP margin of the past two decades (10.7 points) and actually won by an even larger margin (18.2 points)—the largest winning margin since RCP began tracking the numbers. In that year, the RCP average was close to the national vote, but the latter considerably undercounted the House seat results, with Democrats winning 33 more seats than their proportion of the national vote would have suggested.
That was, of course, a general election, with Barack Obama at the head of the ticket. While the Democrats have no such leader in this midterm election, they have the reverse. The GOP is saddled with a highly unpopular president who nevertheless insists on campaigning, and wants Republican voters to pretend he is on the ballot. Making an unpopular president the focus of the campaign could redound to the other party’s favor.
With the Cook Report as a guide, a blowout would entail Democrats winning all their safe, likely and lean seats, all 21 of the toss-up seats along with the nine that lean Republican, and 14 of the 18 “likely” GOP seats. This would suggest drastically lower turnout among Republicans, not so far reflected in the polls. Such an outcome seems highly unlikely, just as it seems highly unlikely that Republicans would win 14 toss-up seats to retain majority control.
Still, with weeks to go and millions more dollars to spend, either outcome could occur, along with several possibilities less extreme. It’s important to remember that based on the past, the RCP average has only a 50/50 chance of being in the ballpark.
From FAIR via This RSS Feed.
You must log in or register to comment.